Reverse engineering a Wii game script interpreter
Most games nowadays avoid hardcoding behavior in the main program code. It makes the development process a lot easier by allowing people with less programming experience than the core engine developers to contribute by writing scripts which defines how conversations happen in the game, how menus work, how cinematic scenes go, etc. Scripts are usually written in a higher level language than the game engine, as they require less performance and must be portable when the game needs to run on different platforms. Easy, common script languages like Lua or Python are often used (for example, CCP uses Python to describe the EVE Online client GUI, and Microsoft uses Lua in Freelancer to describe cinematics), but some companies like to create their own language and their own interpreter to do this job.
I’m a fan of Namco’s “Tales of” RPG games. I was given a Wii last december as a gift, and bought “Tales of Symphonia: Dawn of the New World”. As a true hacker interested in game development, after finishing the game, I started investigating how this game actually works behind the scenes. After writing software to read the encrypted Wii disc of the game, I analyzed the data contained on the DVD, trying to find what was each file and how the game engine made all of this into a game.
Finding the bytecode
For those who don’t know, the Tales RPG often have a system to display optional conversation between the game protagonists, which are not directly tied to the game scenario but sometimes give more precision on characters or on some story points from before the game. Some examples on Youtube. These are known as “skits” and are displayed as the characters 2D portraits talking and being animated on the screen. I thought this was a good starting point to try to understand how the game works, and thus tried to find the files related to these skits on the disc. What I’m exposing in this article is work that took me about 3 to 4 months and ended at the start of April.
First, using Dolphin, the best (and probably the only) Wii emulator, I logged all the disc files being opened using the “file monitor” feature of this emulator. When opening the first skit in the game, the emulator output was:
W[FileMon]:      31 kB Chat/FC01_001.bin
W[FileMon]:       4 kB Chat/e/FC01_001.bin
I[FileMon]:     248 kB Sound/stream/FC01_001.brstm
It was easy enough to understand that Chat/ probably contained graphics
elements as well as a description of the character picture animation,
and Sound/ contained the voices of the characters. Let’s not talk about the
sound data (maybe in a next article, but they are basically 4-bit ADPCM encoded
sound files) and concentrate ourselves on the Chat/ files.
Both of the .bin files are actually Microsoft
Cabinet archives (.cab)
which can easily be extracted with cabextract or any program
using libmspack. Note that one is at the root of the Chat/ directory, while
one is in the Chat/e/ directory. Actually, here are all
the FC01_001.bin files:
./e/FC01_001.bin
./g/FC01_001.bin
./f/FC01_001.bin
./s/FC01_001.bin
./i/FC01_001.bin
./FC01_001.bin
If you’ve played the game, it’s easy enough to understand what are these
directories. The european version of the game I’m working on have been released
in five languages: english, german, french, spanish
and italian. Looking at the size of the files (31K
for Chat/FC01_001.bin and 4.1K for the language specific ones), we can assume
that the non language specific one contains only images while the others
contains the subtitles for example. Let’s extract these .cab files!
In the non language specific one:
-rw-r--r-- 1 119K Aug 28 2008 ar.dat
In the english one:
-rw-r--r-- 1 33K Aug 15 2009 FC01_001.so
Analyzing the bytecode format
Both of these files seem to be in an unknown format. ar.dat does not even
have a magic number in its header, but FC01_001.so starts with "TSS\0" which
nobody seems to have heard of on the internet. There are a few strings in
the .so file: subtitles, as expected, but also things like restTime (%f) or TCP balloon(%d). Not looking too good so far! That’s when static
analysis of the files start to show its limits, and it’s time to run the
Dolphin debugger to find what is actually accessing the .so file when it is
loaded in memory. First, I paused the code execution while it was displaying a
skit and dumped the contents of the RAM. By locating the "TSS\0" string, I
found out that the .so file was loaded at offset 0x816D8394 when executing
the skit. I proceeded to modify the PowerPC interpreter in the Dolphin emulator
to dump the CPU state in JSON at each memory read or write in the zone
containing the .so file, and ran the skit once more to get a full dump of
what code is actually accessing our file.
First, there seems to be some copying going on : the same instruction is
writing data in the zone from top to bottom, starting at 0x816E0393 down
to 0x816D8394. Classic memcpy, nothing to see here. After that, the four
first bytes are read by an instruction at 0x80071E0C. Let’s fire IDA to see
what this is about:
.text2:80071E0C                 lwz     %r3, 0(%r21)
.text2:80071E10                 addis   %r0, %r3, -0x5453
.text2:80071E14                 cmplwi  %r0, 0x5300
.text2:80071E18                 beq     loc_80071E40
If you are not familiar with PowerPC assembly, what this does line by line is
loading a word (32 bytes) at the address contained in r21, then add -0x54530000
to it, and compare it to 0x5300. In other words, it compares the first four
bytes of the file to 0x54535300, which is "TSS\0", the four characters code
which describe the file type. The rest of the code in this function is very
large, let’s not waste time and go to the next memory access to find an
interesting one.
Some fields in the header seems to be read :
offsets 0x4, 0xC, 0x14, 0x18, 0x1C, 0x8, 0x10, and then a lot of
repeated accesses from code at address 0x80091DBC on always different offsets
(0x7D40, 0x7D48, then 0x742C, etc.). Let’s look at the code control flow
there:
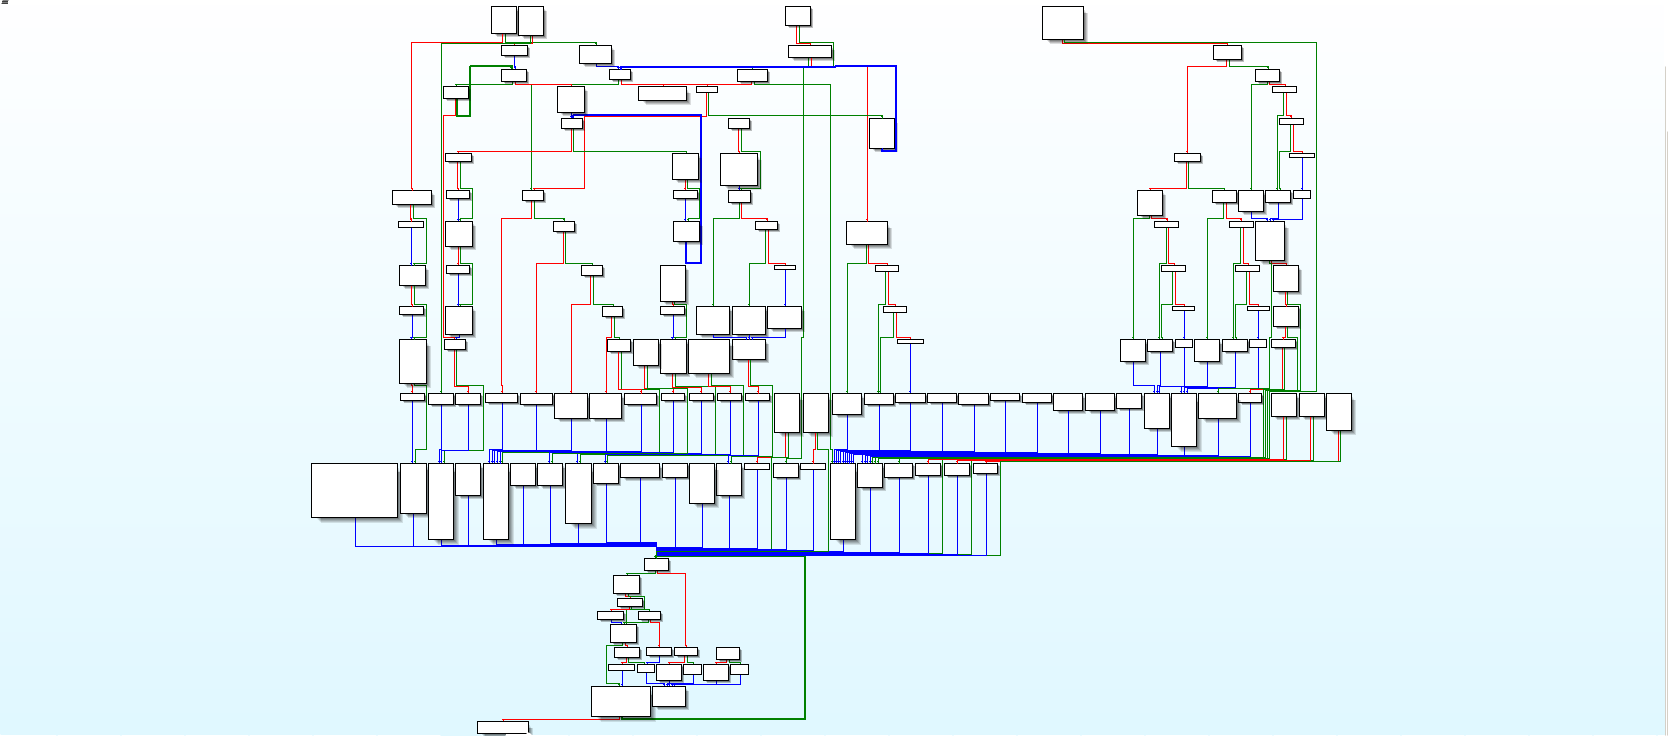
Control flow graph from the IDA disassembly.
An experienced eye may directly recognize a switch statement here: loads of
code without a visible predecessor, all leading to the same exit. I’d even go
further and assume that is the main loop of a script interpreter. That would
make of the .so file a Script Object file, containing compiled
bytecode. Sounds consistent. If we look more precisely at the
code 0x80091DBC which is reading the bytecode in memory, we can see that it
is used to choose where to jump in the switch. In other words, it is the
dispatch code of the bytecode interpretation loop, reading an opcode and
dispatching it to handling code. From there, we can get nice informations: if
it loads the opcode from memory then we can find where is the “current
instruction” pointer, aka. PC (program counter). Let’s look for that! This is
the interesting part of the code:
lwz     %r0, 0xC(%r15)
lwz     %r4, 4(%r15)
mulli   %r0, %r0, 0x1420
add     %r5, %r15, %r0
lwz     %r3, 0x142C(%r5)
lwzx    %r17, %r4, %r3  # Read opcode
The last instruction loads a word indexed from memory. This means it loads the
word at address r4 + r3. Looking at the memory dump we did with Dolphin, we
can see the value of those two registers: 'r3':'00007D40', 'r4':'816D83B4'.
So r4 is the address of the bytecode file (0x816D8394) + 0x20, which we
can assume to be the address of the first opcode in the file, after the
bytecode header. r3 is the PC, which varies while we are executing the code.
They are both stored in some sort of interpreter state, whose address is stored
in r15. In this state is the code base address, at offset 0x4 (second
instruction of the listing), and some sort of table index at
offset 0xC (loaded in the first instruction of the listing, then multiplied
by a constant, and used as an index). This index is used to find the current
PC. From that, we can assume that there can be multiple PCs stored at the same
time, depending on the value of r15[0xC]. Hm…
Let’s increase the usefulness of our memory dump by also dumping memory accesses to the whole interpreter state.
Reverse engineering opcodes
{'type':'r', 'size':4, 'addr':'016E1964', 'val': '00007D40', 'pc':'80091DB8'
{'type':'r', 'size':4, 'addr':'016E00F4', 'val': '11000000', 'pc':'80091DBC'
{'type':'w', 'size':4, 'addr':'016E1964', 'val': '00007D44', 'pc':'80091DC8'
{'type':'r', 'size':4, 'addr':'016E0544', 'val': '00000000', 'pc':'80092720'
{'type':'r', 'size':4, 'addr':'016E053C', 'val': '816D83B4', 'pc':'80092724'
{'type':'r', 'size':4, 'addr':'016E1964', 'val': '00007D44', 'pc':'80092730'
{'type':'r', 'size':4, 'addr':'016E00F8', 'val': '00000000', 'pc':'80092734'
{'type':'w', 'size':4, 'addr':'016E1964', 'val': '00007D48', 'pc':'8009273C'
After dumping all of that, we have log files containing 188MB of JSON with the CPU state at each access. Not particularly easy or useful to read.
We need to enhance this by using the informations we already have on the
interpreter behavior (where PC is stored, where is the instruction dispatcher,
etc.). I wrote a very simple script called filter.py, which iterates on each
line, loads the JSON object as a Python dict, applies a list of filters to it
and prints the filtered line. Here is an example of a filter which detects
lines in the dump from the instruction dispatcher:
(lambda d: d['pc'] == '80091DBC',
 'ReadInstr: %(val)s at pc=%(r3)s (@ %(pc)s)',
 'blue'),
It’s a tuple with a predicate function, a format string which will be formatted
using the JSON object itself, and a color which is translated to the equivalent
ANSI color code (for blue, it is \e[34m). We can also write filters for
instructions trying to access the script bytecode, and instructions
manipulating the Program Counter (PC):
(lambda d: (int(d['addr'], 16) - 0x016E1964) % 5152 == 0
           and int(d['addr'], 16) >= 0x016E195C
           and d['type'] == 'r',
 '  GetPC: %(val)s at addr=%(addr)s (@ %(pc)s)',
 'green'),
(lambda d: (int(d['addr'], 16) - 0x016E1964) % 5152 == 0
           and int(d['addr'], 16) >= 0x016E195C
           and d['type'] == 'w',
 '  SetPC: %(val)s at addr=%(addr)s (@ %(pc)s)',
 'red'),

(lambda d: 0 <= int(d['off'], 16) < 0x8191,
 'SoAccess: type=%(type)s val=%(val)s at off=%(off)s (@ %(pc)s)',
 'yellow'),
Now that we know where the PC is stored, a first step would we to locate the
control flow handling instructions. I took all of the ReadInstr lines from
the dump and analyzed the PC value to see which instruction was doing jumps,
i.e. after which instruction is the PC at least 0x10 more or less than its
previous value. I won’t paste the script here (it’s easy to code but a bit
long), but it was of a great use, finding only four instructions modifying the
control flow. Opcodes starting by 05, 06, 08 and 09 all modified at least at
one time in the dump the value of PC. Looking at the dump, 05 and 06 seems to
do a lot of stuff, storing and loading from addresses we don’t know about yet,
but analyzing the PC after and before those opcodes, we can determine easily
enough that they are the usual CALL/RET instructions. For example:
Opcode 05 at 7D48, jumping to 742C
  Opcode 05 at 7434, jumping to 6FA0
    Opcode 05 at 6FB8, jumping to 6D8C
    Opcode 06 at 6D88, jumping to 6FC0
  Opcode 06 at 6F9C, jumping to 743C
See how the jump address from opcode 06 are always just after an opcode 05? Looking at the dump a bit closer, we can also see that op05 writes its next instruction PC somewhere in the interpreter state (let’s now call this somewhere “the stack”), and op06 reads it from exactly the same place! Let’s look at opcode 08 now in the memory accesses dump:
ReadInstr: 08000000 at pc=00006E24 (@ 80091DBC)
  SetPC: 00006E28 at addr=016E1964 (@ 80091DC8)
{'type':'r', 'size':4, 'addr':'016E0544', 'val': '00000000', 'pc':'800923EC'
{'type':'r', 'size':4, 'addr':'016E053C', 'val': '816D83B4', 'pc':'800923F0'
  GetPC: 00006E28 at addr=016E1964 (@ 800923FC)
SoAccess: type=r val=00006D80 at off=00006E48 (@ 80092400)
  SetPC: 00006E2C at addr=016E1964 (@ 80092408)
{'type':'r', 'size':4, 'addr':'016E0544', 'val': '00000000', 'pc':'8009240C'
  SetPC: 00006D80 at addr=016E1964 (@ 80092418)
So… it reads instruction 8, adds 4 to the PC, reads a word from the bytecode,
adds 4 to the PC, then sets the PC to the word read in the bytecode. In other
words, after executing 08000000 12345678, PC=12345678. That’s an absolute
jump, which seems unconditional: every time an opcode 08 is encountered in the
dump, PC is modified. That means opcode 09 is most likely a conditional jump:
they are almost always used to implement loops and if statements. Two parts
of the dump related to opcode 09 seems to confirm that:
ReadInstr: 09000000 at pc=00000500 (@ 80091DBC)
  SetPC: 00000504 at addr=016E1964 (@ 80091DC8)
{'type':'r', 'size':4, 'addr':'016E0544', 'val': '00000000', 'pc':'80092420'
{'type':'r', 'size':4, 'addr':'016E053C', 'val': '816D83B4', 'pc':'80092424'
  GetPC: 00000504 at addr=016E1964 (@ 80092430)
SoAccess: type=r val=00000564 at off=00000524 (@ 80092434)
  SetPC: 00000508 at addr=016E1964 (@ 8009243C)
{'type':'r', 'size':4, 'addr':'016E0544', 'val': '00000000', 'pc':'80092440'
{'type':'r', 'size':4, 'addr':'016E115C', 'val': '00000000', 'pc':'8009244C'
{'type':'r', 'size':4, 'addr':'016E055C', 'val': '00000000', 'pc':'80092458'
  SetPC: 00000564 at addr=016E1964 (@ 80092464)
{'type':'r', 'size':1, 'addr':'016E0558', 'val': '00000000', 'pc':'80091CFC'
{'type':'r', 'size':4, 'addr':'016E0544', 'val': '00000000', 'pc':'80091D38'
{'type':'r', 'size':4, 'addr':'016E1970', 'val': '00000011', 'pc':'80091D44'
{'type':'r', 'size':4, 'addr':'016E0544', 'val': '00000000', 'pc':'80091D78'
{'type':'r', 'size':4, 'addr':'016E1970', 'val': '00000011', 'pc':'80091D84'
{'type':'r', 'size':4, 'addr':'016E0544', 'val': '00000000', 'pc':'80091DA8'
{'type':'r', 'size':4, 'addr':'016E053C', 'val': '816D83B4', 'pc':'80091DAC'
In this case, we jumped to 0564 with the opcode 09000000 00000564. However,
another part of the dump shows us that opcode 09 does not always jump:
ReadInstr: 09000000 at pc=000065A4 (@ 80091DBC)
  SetPC: 000065A8 at addr=016E1964 (@ 80091DC8)
{'type':'r', 'size':4, 'addr':'016E0544', 'val': '00000000', 'pc':'80092420'
{'type':'r', 'size':4, 'addr':'016E053C', 'val': '816D83B4', 'pc':'80092424'
  GetPC: 000065A8 at addr=016E1964 (@ 80092430)
SoAccess: type=r val=000065EC at off=000065C8 (@ 80092434)
  SetPC: 000065AC at addr=016E1964 (@ 8009243C)
{'type':'r', 'size':4, 'addr':'016E0544', 'val': '00000000', 'pc':'80092440'
{'type':'r', 'size':4, 'addr':'016E115C', 'val': '00000000', 'pc':'8009244C'
{'type':'r', 'size':4, 'addr':'016E055C', 'val': '00000001', 'pc':'80092458'
{'type':'r', 'size':1, 'addr':'016E0558', 'val': '00000000', 'pc':'80091CFC'
{'type':'r', 'size':4, 'addr':'016E0544', 'val': '00000000', 'pc':'80091D38'
{'type':'r', 'size':4, 'addr':'016E1970', 'val': '00000011', 'pc':'80091D44'
{'type':'r', 'size':4, 'addr':'016E0544', 'val': '00000000', 'pc':'80091D78'
{'type':'r', 'size':4, 'addr':'016E1970', 'val': '00000011', 'pc':'80091D84'
{'type':'r', 'size':4, 'addr':'016E0544', 'val': '00000000', 'pc':'80091DA8'
{'type':'r', 'size':4, 'addr':'016E053C', 'val': '816D83B4', 'pc':'80091DAC'
See the missing SetPC? We can safely assume we know most of the behavior of
the four control flow handling
instructions: 05=CALL, 06=RET, 07=JUMP and 08=CJUMP. But now, we also
know that there is some kind of stack used for CALL/RET. Let’s add some new
filters to our script in order to detect easily instructions manipulating this
stack:
(lambda d: (int(d['addr'], 16) - 0x016E1160) % 5152 == 0
           and int(d['addr'], 16) >= (0x016E195C - 5152)
           and d['type'] == 'r',
 '  GetStackAddr: %(val)s at addr=%(addr)s (@ %(pc)s)',
 'green'),
(lambda d: (int(d['addr'], 16) - 0x016E1160) % 5152 == 0
           and int(d['addr'], 16) >= (0x016E195C - 5152)
           and d['type'] == 'w',
 '  SetStackAddr: %(val)s at addr=%(addr)s (@ %(pc)s)',
 'red'),

(lambda d: (int(d['addr'], 16) - 0x016E1968) % 5152 == 0
           and int(d['addr'], 16) >= 0x016E195C
           and d['type'] == 'r',
 '  GetStackTop: %(val)s at addr=%(addr)s (@ %(pc)s)',
 'green'),
(lambda d: (int(d['addr'], 16) - 0x016E1968) % 5152 == 0
           and int(d['addr'], 16) >= 0x016E195C
           and d['type'] == 'w',
 '  SetStackTop: %(val)s at addr=%(addr)s (@ %(pc)s)',
 'red'),

(lambda d: (int(d['addr'], 16) - 0x016E1164) % 5152 <= 0x800
           and int(d['addr'], 16) >= (0x016E1164)
           and d['type'] == 'r',
 '  GetStack: %(val)s at stack off %(soff)s (addr=%(addr)s @ %(pc)s)',
 'yellow'),
(lambda d: (int(d['addr'], 16) - 0x016E1164) % 5152 <= 0x800
           and int(d['addr'], 16) >= (0x016E1164)
           and d['type'] == 'w',
 '  SetStack: %(val)s at stack off %(soff)s (addr=%(addr)s @ %(pc)s)',
 'cyan'),
Let’s re-run our filtering script on the dump and find instructions that access the stack! Opcode 11 seems to be quite small and modifies the stack top, let’s look at it more closely:
ReadInstr: 11000000 at pc=0000000C (@ 80091DBC)
  SetPC: 00000010 at addr=016E2D84 (@ 80091DC8)
{'type':'r', 'size':4, 'addr':'016E0544', 'val': '00000001', 'pc':'80092720'
{'type':'r', 'size':4, 'addr':'016E053C', 'val': '816D83B4', 'pc':'80092724'
  GetPC: 00000010 at addr=016E2D84 (@ 80092730)
SoAccess: type=r val=00000008 at off=00000030 (@ 80092734)
  SetPC: 00000014 at addr=016E2D84 (@ 8009273C)
{'type':'r', 'size':4, 'addr':'016E0544', 'val': '00000001', 'pc':'80092740'
  GetStackTop: 000007B8 at addr=016E2D88 (@ 8009274C)
{'type':'r', 'size':4, 'addr':'016E0544', 'val': '00000001', 'pc':'80092764'
  GetStackTop: 000007B8 at addr=016E2D88 (@ 80092770)
  SetStackTop: 000007B0 at addr=016E2D88 (@ 80092778)

ReadInstr: 11000000 at pc=00000158 (@ 80091DBC)
  SetPC: 0000015C at addr=016E1964 (@ 80091DC8)
{'type':'r', 'size':4, 'addr':'016E0544', 'val': '00000000', 'pc':'80092720'
{'type':'r', 'size':4, 'addr':'016E053C', 'val': '816D83B4', 'pc':'80092724'
  GetPC: 0000015C at addr=016E1964 (@ 80092730)
SoAccess: type=r val=00000000 at off=0000017C (@ 80092734)
  SetPC: 00000160 at addr=016E1964 (@ 8009273C)
{'type':'r', 'size':4, 'addr':'016E0544', 'val': '00000000', 'pc':'80092740'
  GetStackTop: 00000794 at addr=016E1968 (@ 8009274C)
{'type':'r', 'size':4, 'addr':'016E0544', 'val': '00000000', 'pc':'80092764'
  GetStackTop: 00000794 at addr=016E1968 (@ 80092770)
  SetStackTop: 00000794 at addr=016E1968 (@ 80092778)
Opcode 11 seems to read an argument just after the bytecode in the file and
substracts it from the stack top. For example, 11000000 00000010 removes 0x10 from the stack top. Most of the time this is done to
reserve space for local variables (for example, on x86 you do sub esp, 0x10),
so let’s call this instruction RESERVE. Opcode 10 seems to do almost the same
thing but adds to the stack top instead of substracting, so let’s call
it UNRESERVE.
Conclusion and future work
After a lot more work, many of the instructions were identified. Along the way, I was able to understand how the interpreter stores its local variables, how they are represent in memory, and more. I will unfortunately not go into it in this article (in fact, this conclusion is written 12 years after I left my readers hanging waiting for a “part 3”…).
The final result of this reverse engineering work is a completely rewritten version of the bytecode interpreter, which can be found on my GitHub : cscript-interpreter. This is able to execute skit scripts quite well, even if there is still a bit of reverse engineering to do on the syscalls part.